STRANGE SIGNALS Open the map

In development, live now

STRANGE SIGNALS

Every major paranormal dataset plotted on one map, 385,531 reports, with a math engine that separates the signal from the noise.

Runs in a desktop browser with nothing to install. The first visit loads about 30 MB of data, then your browser keeps it.

SCAN DOWN
385,531geocoded reports
372,518UFO / UAP
8,776haunted places
4,237Bigfoot
12overlay layers
593 BCto the present

01 / THE PROBLEM

Raw counts mostly tell you where people live

Plot every report and you get a population map. The Signal Engine builds an expected count for each hex cell from census population and the region's reporting rate, then tests the real count against it.

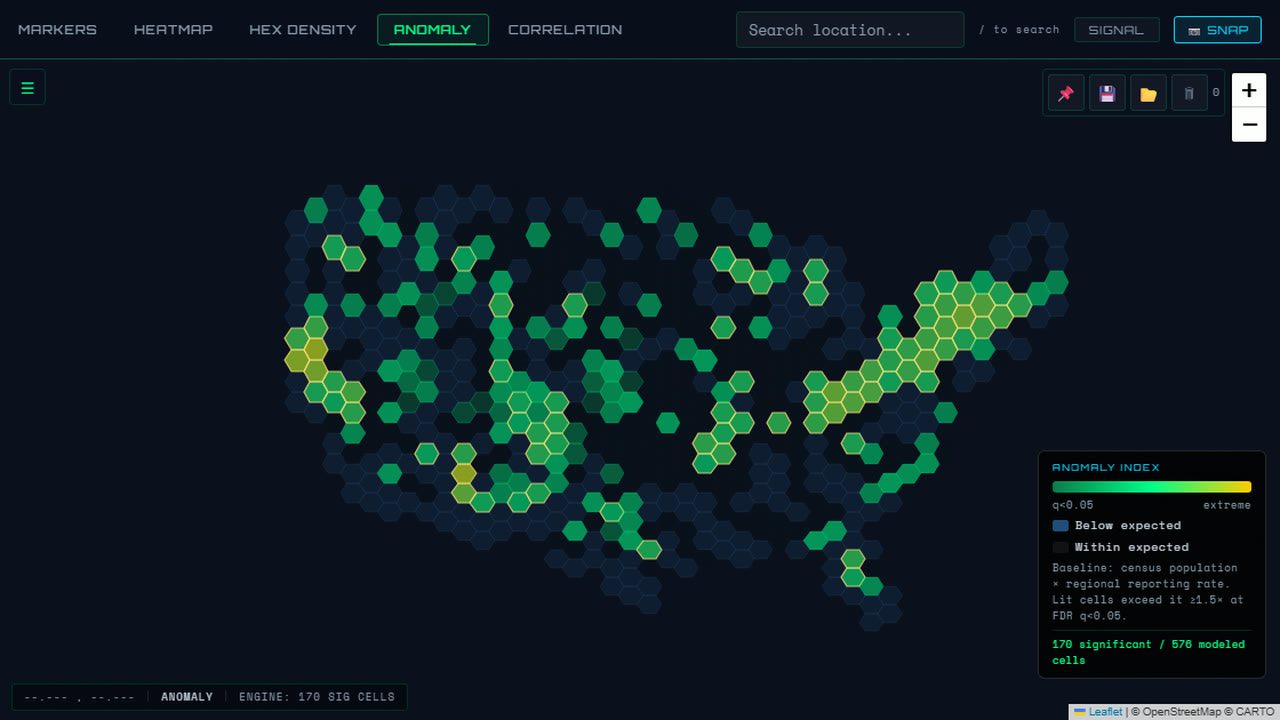
A cell stays lit only if it beats that baseline: a Poisson test, Benjamini-Hochberg false-discovery control at q below 0.05, and a rate ratio of at least 1.5. Cells with significantly fewer reports than expected show in blue. Big cities alone do not light up.

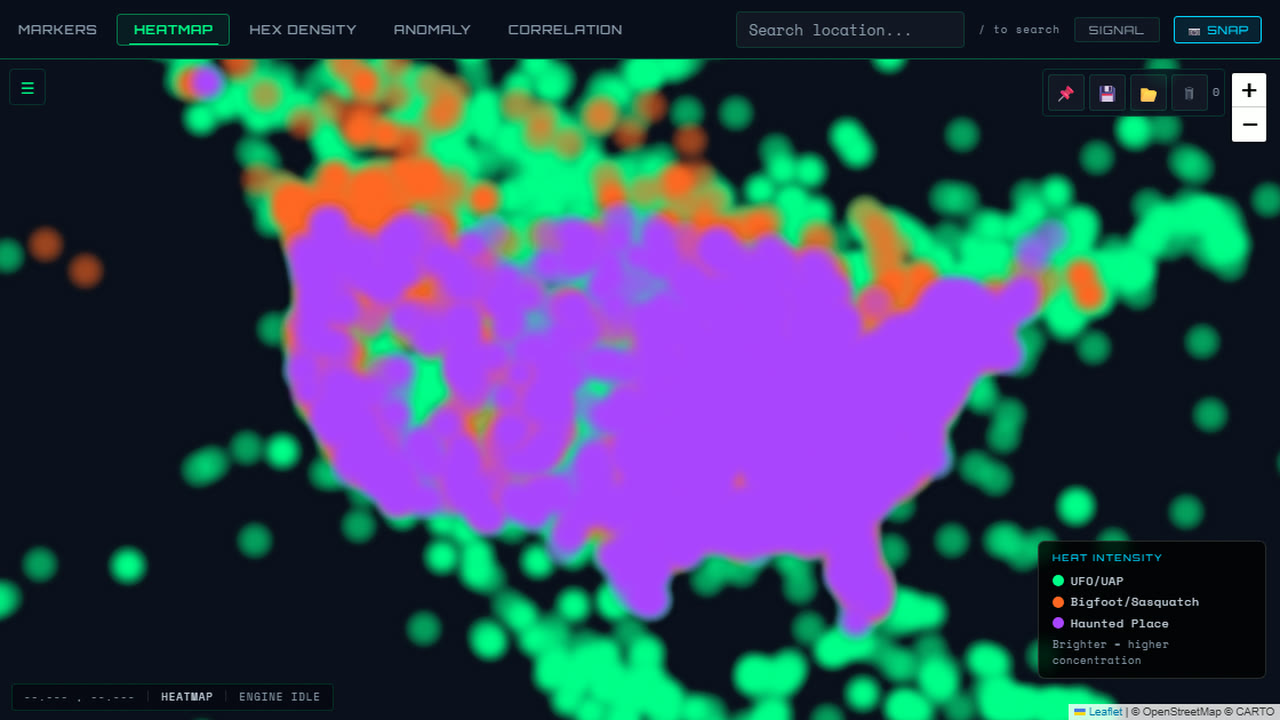
HEATMAP: RAW DENSITY The Heatmap view: a solid purple and green blob that follows where people live.
ANOMALY: AFTER THE CORRECTION The Anomaly view: a hex grid where only the cells above the population baseline glow green to amber.

02 / DEEP DIVE

Right-click anywhere for a dossier

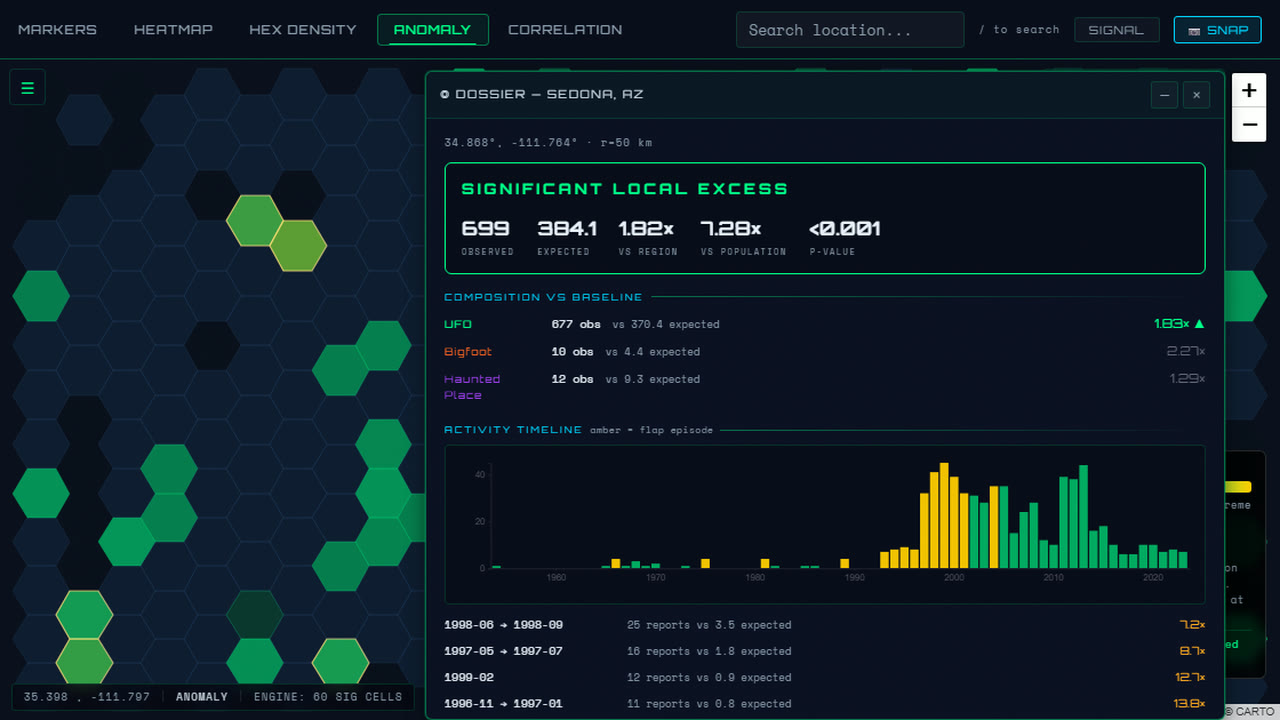
Pick a point and the app runs a 50 km survey around it: an anomaly verdict, per-category rate ratios, space-time flap episodes, seasonality against the national pattern, and a report you can export as a standalone HTML file.

Sedona, Arizona logs 699 reports against 384.1 expected, 7.28 times its population baseline (p below 0.001). The dossier then argues against itself, listing nearby airports and other overlays that could explain the number.

DOSSIER: SEDONA, AZ

03 / THE BORING EXPLANATIONS

Rule out the obvious first

Twelve overlay layers sit on the same map: military and DOE sites, restricted airspace, airports, national parks, earthquakes, caves, NASA fireballs, cryptid sightings, Missing 411 cases, historic sites, geomagnetic storms and a per-capita heatmap.

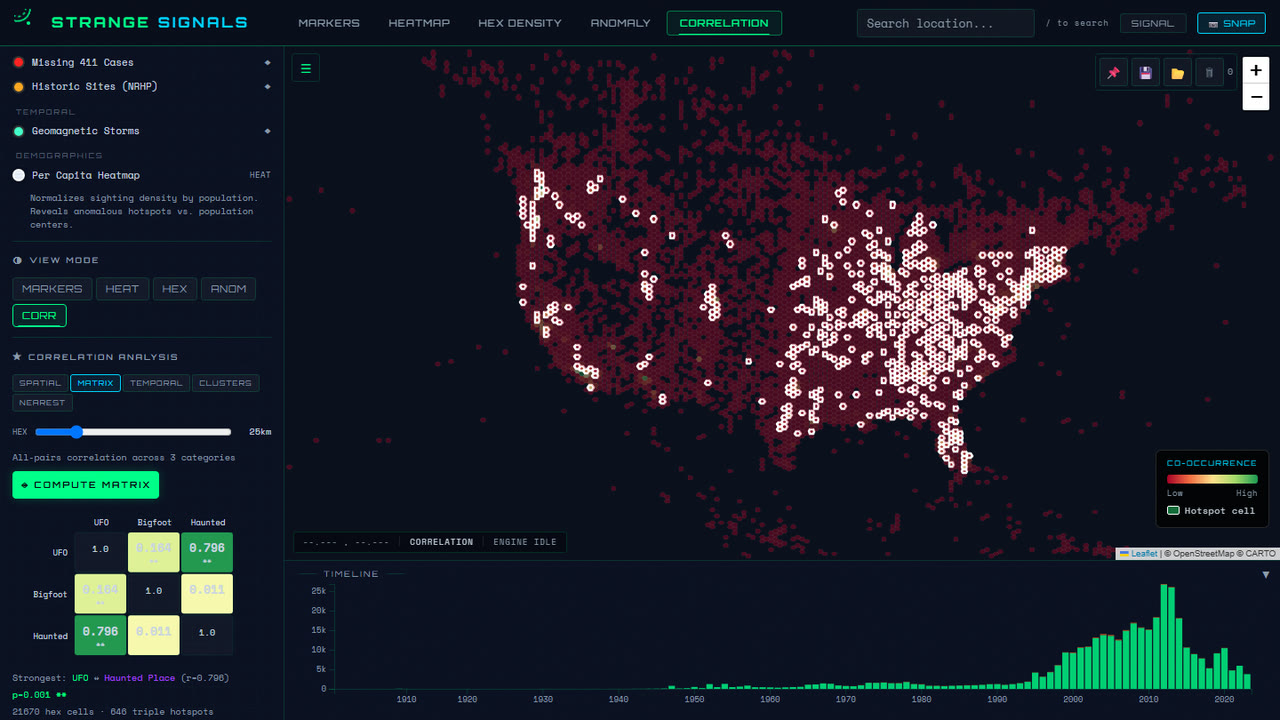
Here, the Nevada Test and Training Range with military sites, restricted airspace and airports switched on, one at a time. Spatial correlations report the raw r next to the population-adjusted r, so "ghosts correlate with UFOs" cannot hide "cities exist".

OVERLAYS: NEVADA

04 / THE ANALYST

Ask SIGNAL, and watch it work

SIGNAL is a built-in analyst powered by Claude. It drives the map through tool calls: hunting anomalies with the Signal Engine, running deep dives, filtering, correlating, placing pins, capturing the map into illustrated reports. Every call shows up in a live investigation log.

The app says you can try it with no setup while a free daily allowance lasts. After that, paste in your own Anthropic API key, which stays in your browser. All map features work without the analyst.

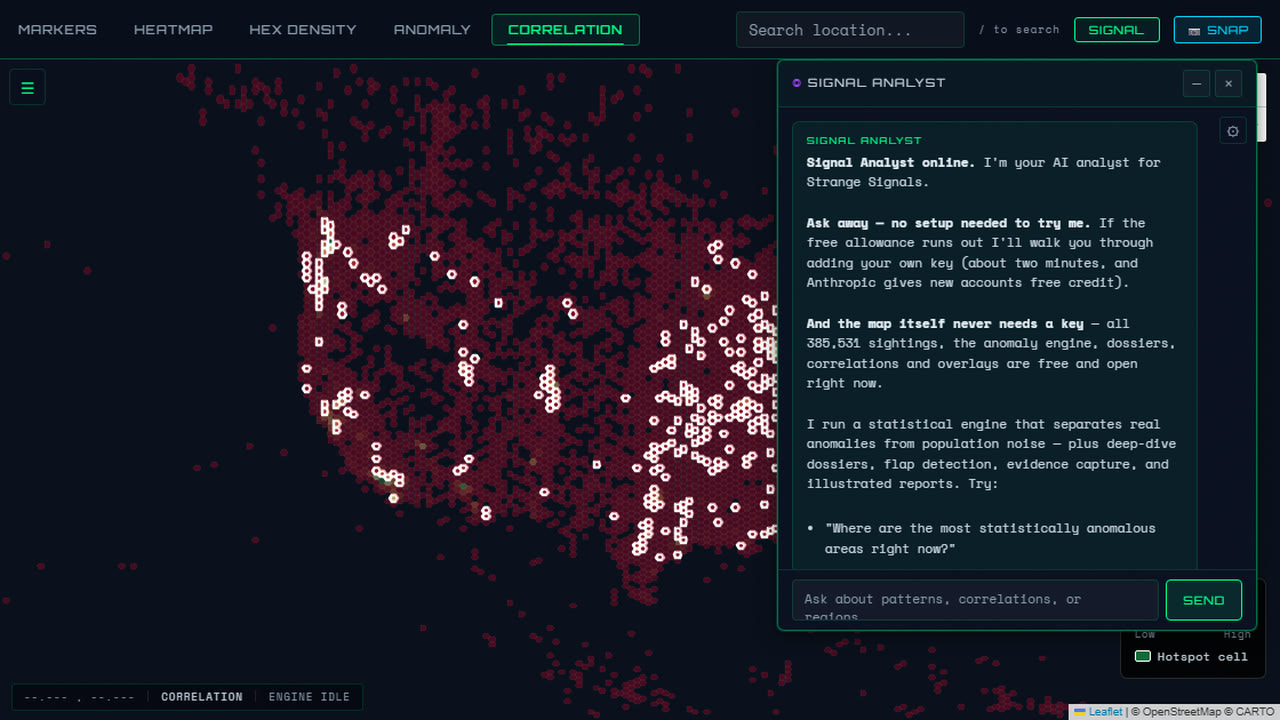
SIGNAL ANALYST The SIGNAL Analyst panel open over the correlation map, greeting the visitor and offering research prompts.

05 / HOW IT WAS MADE

A map first, then an instrument

Stewart Gregerson built Strange Signals with Claude Code as his pair engineer. It started on 13 March 2026 as a plain correlation map. In June a written diagnosis turned it into something stricter.

An honest diagnosis

The v2 vision document opens by calling v1 out: it plotted where people report things, so population drove every number. Hexes were tested with no multiple-comparison control, and "UFOs correlate with Haunted Places" mostly meant "both happen where people live". The fix was a pure-math module, signal-engine.js, with no map code in it.

Zero build, big data

The app is plain HTML, CSS and JavaScript on Leaflet, Turf and D3, with no bundler. A Python pipeline merges nine source CSVs and geocodes about 109,000 NUFORC reports. The UFO file is split into three gzipped shards to stay under Cloudflare's 25 MiB per-asset limit, each parsed in its own Web Worker and cached by a Service Worker.

Claims get checked

A rumored surge in NASA fireball detections was tested against primary CNEOS counts and refuted; the brief is in the repo. When a pipeline dedup bug was found truncating every description, the whole dataset was rebuilt rather than patched.

  1. The first build. A full-featured correlation map for UFO, Bigfoot and haunted-place reports.
  2. The correlation suite. Spatial, temporal, cluster and nearest-neighbor analysis.
  3. SIGNAL arrives. The AI analyst, a draggable window system and chart and report tools.
  4. The v2 vision. The product is not the map, it is the residual: where there is more than there should be.
  5. Progressive first paint. The two small categories appear in about 0.6 seconds while the big UFO file streams in.
  6. Live on Cloudflare. Deployed as static assets, with an optional shared analyst and a plain-language API key walkthrough.

Data and credits

Strange Signals plots public datasets. Each belongs to its authors and keeps its own terms; check the source before reusing any of it.

Sightings

  • NUFORC reports via the HuggingFace NUFORC dataset (geocoded here from a city gazetteer) and the TidyTuesday 2023-06-20 release. The reports belong to the National UFO Reporting Center.
  • planetsig/ufo-reports: geocoded UFO reports.
  • Larry Hatch *U* database via RR0/uDb: the historical catalog back to 593 BC.
  • BFRO Bigfoot reports via TidyTuesday 2022-09-13 and Christopher1994-1/bigfoot-dataset-website.
  • Haunted Places: the Shadowlands database, via TidyTuesday 2023-10-10.

Overlays

  • Airports: OurAirports, public domain.
  • Earthquakes: USGS earthquake catalog (US government data).
  • Fireballs: NASA/JPL CNEOS fireball database.
  • Geomagnetic storms: NOAA Space Weather Prediction Center plus a historical event list.
  • Restricted airspace: compiled from FAA special use airspace charts.
  • Military sites and national parks: US DOT military bases and National Park Service boundaries.
  • Population baseline: US Census county population and land area.
  • Caves, historic sites, cryptids, Missing 411: curated lists compiled for this project.

Software

  • Leaflet 1.9.4 (BSD-2), Leaflet.markercluster (MIT), leaflet-heat (BSD-2).
  • Turf.js 7.3.5 (MIT), D3 7.9.0 (ISC), html2canvas 1.4.1 (MIT).
  • Basemap: CARTO Dark Matter, data from OpenStreetMap contributors.
  • Fonts: Orbitron and Space Mono, SIL Open Font License 1.1.
  • SIGNAL Analyst: Anthropic's Claude API.